
Competitive landscape: TL1A
Three CLI commands and one script produce a competitive landscape for a target: a spreadsheet, a bullseye chart and the supporting statistics. This page is the whole run, with real output.
The shape is the one to copy for any target: fetch to disk, check what came back, then build.
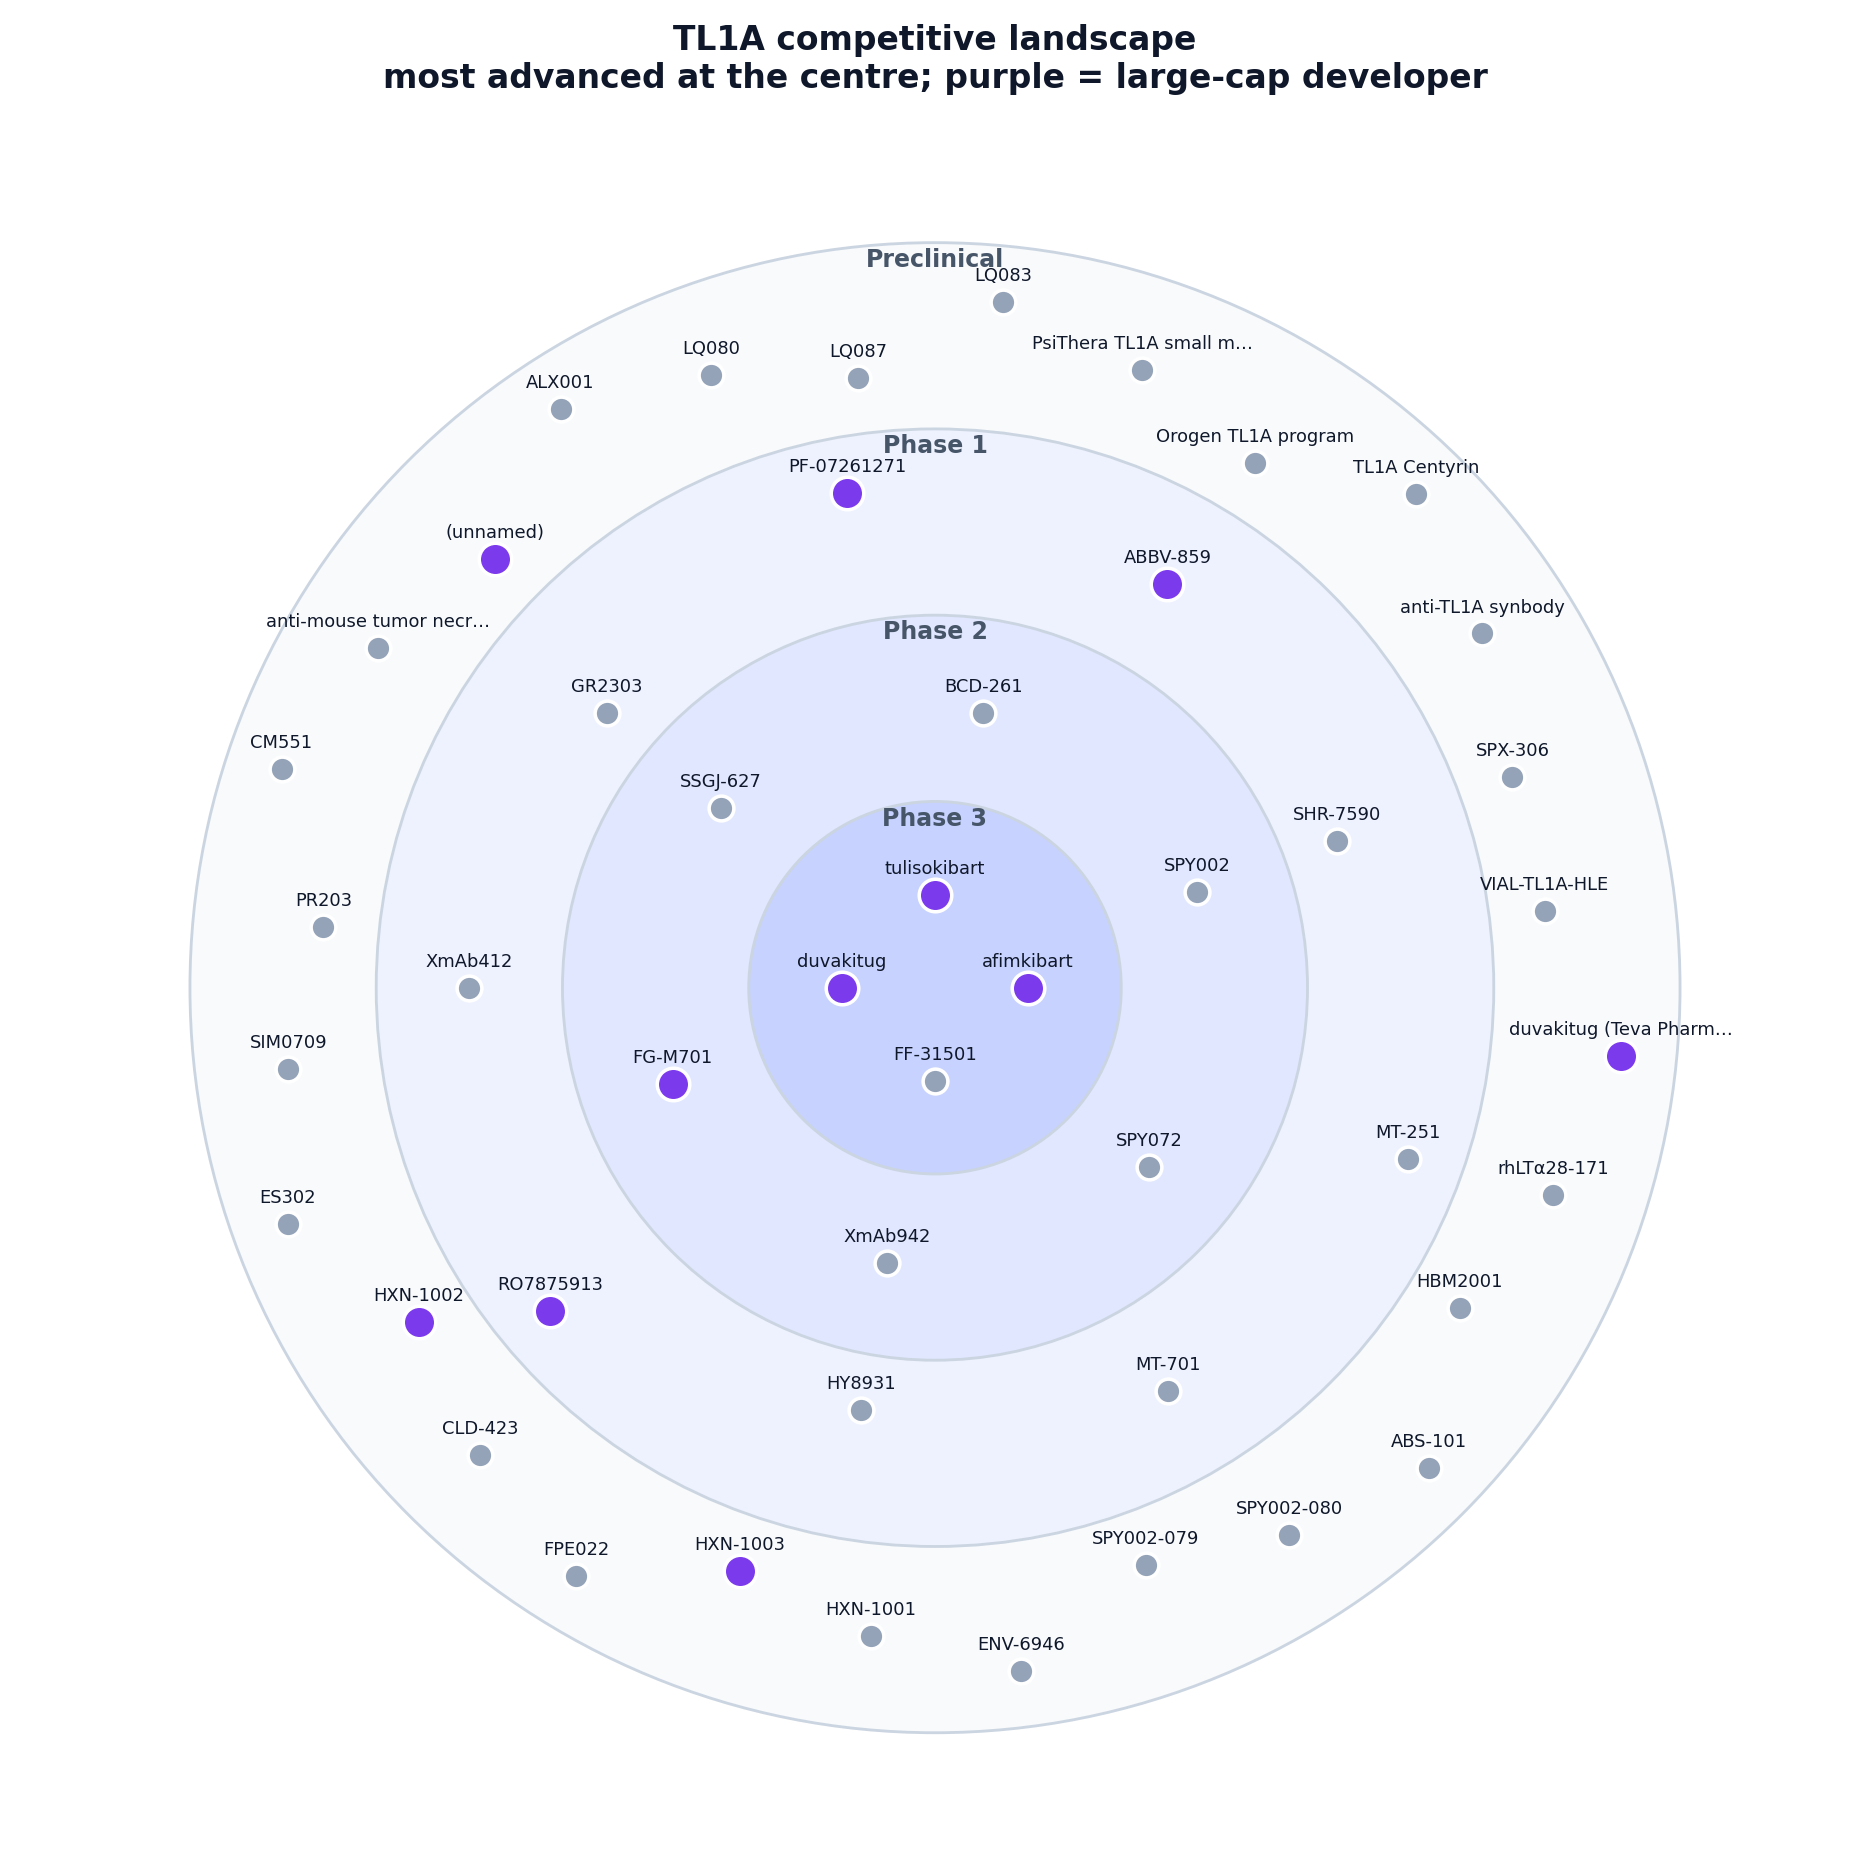
What you get
tl1a_landscape.xlsx, three sheets: assets, trials, dealstl1a_bullseye.png, the chart above, most advanced at the centretl1a_charts.png, phase distribution, developers, trial starts per year
How it works
A landscape is three questions asked of three collections, then joined:
| question it answers | |
|---|---|
| drugs | who is developing something against this target, and how far along |
| trials | what is actually being tested, in whom, and has it read out |
| deals | who bought in, at what stage, and for how much |
Each command writes plain JSON to a file. Nothing is streamed or held in memory, which matters for the next part: once the three files are on disk, an agent can read them, check them and build from them without going back to the network. It also means you can rerun the build without re-pulling.
Using it with Claude Code or Codex
The CLI was built to be driven by an agent as much as by a person. Output is JSON, every command self-describes, and field names are discoverable, so an agent can work out how to answer a question without being told the schema.
One-time setup. Install and sign in, then tell your agent the tool exists by dropping this in CLAUDE.md (Claude Code) or AGENTS.md (Codex), at the root of wherever you work:
## Gosset CLI

`gosset` is installed and authenticated. It queries drugs, clinical trials,
companies, deals and news, and outputs JSON.

- `gosset --help` lists the commands
- `gosset <command> --help` lists that command's filters
- `gosset schema` lists the entities, `gosset schema <entity>` lists its fields

Prefer it over web search for drug, trial, company and deal questions.
Don't guess field names, run `gosset schema` first. Add `--table` when
showing me results, keep JSON when piping.
That's the whole integration. There is no plugin to install and no MCP server to run: it is a normal command-line tool, so any agent that can run a shell can use it.
Then just ask. In that directory:
Build me a TL1A competitive landscape. Pull the drugs, trials and deals from the
gosset CLI, check the pull, then give me a spreadsheet, a bullseye and charts.
The rest of this page is what a good agent does in response, so you can follow along, run it yourself, or hand it over as a worked example.
Without a memory file
You don't strictly need CLAUDE.md. Saying "use the gosset CLI, run gosset --help first" in the conversation works fine for one-off questions. The file just saves you repeating it.
1. Sign in
pip install gosset
gosset auth
One browser sign-in. The key is stored, so every later command picks it up.
2. Pull the three datasets
gosset drugs  --target TL1A --all > drugs.json
gosset trials --target TL1A --all > trials.json
gosset deals  --target TL1A --all > deals.json
--all fetches the whole cohort however large it is. It pages internally, picks a stable sort, deduplicates, and emits one JSON array, so there is no loop to write and nothing to get wrong. It refuses above 10,000 rows and tells you to add filters, which is the right answer for a query that broad.
Targets resolve from any common name, so --target TL1A, --target TNFSF15 and --target "TNF-like ligand 1A" return the same cohort. The same holds for subunits and the complexes they form: --target IL23A and --target IL-23 answer the same question. You don't need to know which name the database prefers.
52 assets, 66 trials, 149 deals.
3. Check the pull
Two minutes before anything is charted. Paste this in one go:
echo "rows:" && jq length drugs.json

echo "phase vs status:"
jq -r '.[] | "\(.phase)\t\(.status)"' drugs.json | sort | uniq -c | sort -rn

echo "same asset entered twice:"
jq -r '.[].name | select(. != null)' drugs.json | sed 's/ *([^)]*)$//' | sort | uniq -d

echo "the leaders:"
jq -r '.[] | select(.phase == "3") | "\(.name)\t\(.lead_developer)"' drugs.json
On this cohort:
rows: 52

phase vs status:
     33 Preclinical   Stale
     18 1/2/3         Active
      1 Discontinued  Discontinued

same asset entered twice:
(nothing)

the leaders:
tulisokibart   Merck & Co.
afimkibart     Roche
duvakitug      Sanofi
What each one is for:
| check | what you are looking for |
|---|---|
| rows | that the number matches what you expect. Every data problem found while writing these pages was visible from the row count and the top ten. |
| phase vs status | phase is how far a programme got; status is whether the record is maintained. 33 of 52 here are Stale, so "in the clinic" counts what reached the clinic, not what is running. Filter on Active for live competition. |
| entered twice | a trailing parenthesis, a sponsor or a version number, can split one programme across two records. Clean on this cohort. |
| the leaders | read the top ten before charting. If a name looks wrong for the disease, it usually is. |
Why select(. != null)
A null name does not make jq skip a row, it aborts the stream. An unguarded filter prints results up to the null and stops, which reads exactly like "nothing else matched".
4. Build
Download the script and run it. It reads the three JSON files and writes the spreadsheet and both images into the same directory.
curl -O https://docs.gosset.ai/build_landscape.py
python build_landscape.py
tl1a_landscape.xlsx Landscape / Trials / Deals sheets
tl1a_bullseye.png the chart at the top of this page
tl1a_charts.png phase split, top developers, trial starts per yearNeeds pandas, matplotlib and openpyxl. Nothing in it is TL1A-specific, so the same file works for any target once you change the three pulls above.
What it does
| step | what happens |
|---|---|
| Sheet 1, Landscape | one row per asset: phase, status, developer, originator, modality, targets, lead indication, trial count, plus flags for combination and large-cap |
| Sheet 2, Trials | NCT, phase, status, sponsor, start date, whether results are posted |
| Sheet 3, Deals | date, type, buyers, sellers, assets, headline |
| Bullseye | concentric rings by phase, most advanced at the centre, purple for large-cap developers |
| Charts | assets by phase, most active developers, trial starts per year |
Two details worth knowing if you adapt it, both of which are easy to get wrong:
modalitiesis a list and its order means nothing. An ADC carries "Monoclonal Antibodies", "Small Molecules" and "Cytotoxic ADCs". Taking the first entry reports sacituzumab govitecan as a plain antibody, so the script joins the leaf of every entry.- Deal parties are objects,
{name, category, country}, andnamecan be present but null, so the script coalesces to""before joining.
Show the full script
import json
from collections import Counter

import matplotlib
matplotlib.use("Agg")
import matplotlib.pyplot as plt
import numpy as np
import pandas as pd

drugs  = json.load(open("drugs.json"))
trials = json.load(open("trials.json"))
deals  = json.load(open("deals.json"))

PHASE_ORDER = ["Preclinical", "1", "2", "3", "4", "Approved"]
BIG_PHARMA = {"Merck & Co.", "Merck KGaA", "Roche", "Genentech", "Pfizer", "Sanofi",
              "AbbVie", "AbbVie Inc.", "Eli Lilly", "Novartis", "AstraZeneca",
              "Bristol Myers Squibb", "GSK", "Takeda", "Amgen", "Johnson & Johnson",
              "Teva Pharmaceutical", "Teva Pharmaceutical Industries",
              "Kyowa Kirin", "Almirall", "Boehringer Ingelheim", "Novo Nordisk"}

def names(seq):
    """Deal parties and assets are objects: {name, category, country}.

    `or ""` rather than a default: the key can be present with a null value,
    and a None in the list makes the later ", ".join raise.
    """
    return [(x.get("name") or "") if isinstance(x, dict) else str(x) for x in (seq or [])]

def first(x, default=""):
    return (x[0] if x else default) if isinstance(x, list) else (x or default)

# ---- sheet 1: the landscape
df = pd.DataFrame([{
    "Asset": d.get("name") or "(unnamed)",
    "Phase": d.get("phase") or "",
    "Lead developer": d.get("lead_developer") or first(d.get("developers")),
    "Originator": d.get("originator") or "",
    "Country": d.get("country") or "",
    # modalities is a LIST and order is not meaningful: an ADC carries
    # "Monoclonal Antibodies", "Small Molecules" AND "Cytotoxic ADCs". Taking
    # [0] would report sacituzumab govitecan as a plain antibody.
    "Modality": ", ".join(sorted({m.split("→")[0].strip() for m in (d.get("modalities") or [])})),
    "Targets": ", ".join(d.get("targets") or []),
    "Lead indication": d.get("lead_indication") or "",
    "Trials": d.get("trial_count") or 0,
    "Combination target": "yes" if len(d.get("targets") or []) > 1 else "no",
    "Big pharma": "yes" if (d.get("lead_developer") in BIG_PHARMA
                            or any(x in BIG_PHARMA for x in d.get("developers") or [])) else "no",
} for d in drugs])
df["_ord"] = df["Phase"].apply(lambda p: PHASE_ORDER.index(p) if p in PHASE_ORDER else -1)
df = df.sort_values(["_ord", "Trials"], ascending=[False, False]).drop(columns="_ord")

tdf = pd.DataFrame([{
    "NCT": t.get("nct_id") or t.get("trial_id"), "Phase": t.get("phase"),
    "Status": t.get("status"), "Sponsor": t.get("lead_sponsor"),
    "Start": t.get("start_date"), "Has results": t.get("has_results"),
    "Title": (t.get("title") or "")[:120],
} for t in trials])

ddf = pd.DataFrame([{
    "Date": d.get("date"),
    "Type": ", ".join(d["deal_type"]) if isinstance(d.get("deal_type"), list) else d.get("deal_type"),
    "Buyers": ", ".join(names(d.get("buyers"))),
    "Sellers": ", ".join(names(d.get("sellers"))),
    "Assets": ", ".join(names(d.get("drugs"))),
    "Title": (d.get("title") or "")[:140],
} for d in deals]).sort_values("Date", ascending=False)

with pd.ExcelWriter("tl1a_landscape.xlsx", engine="openpyxl") as xl:
    df.to_excel(xl, sheet_name="Landscape", index=False)
    tdf.to_excel(xl, sheet_name="Trials", index=False)
    ddf.to_excel(xl, sheet_name="Deals", index=False)

# ---- the bullseye: rings by phase, most advanced at the centre
rings  = ["Preclinical", "1", "2", "3"]
labels = {"Preclinical": "Preclinical", "1": "Phase 1", "2": "Phase 2", "3": "Phase 3"}
radii  = {"3": 1.0, "2": 2.0, "1": 3.0, "Preclinical": 4.0}
inner  = {"3": 0.0, "2": 1.0, "1": 2.0, "Preclinical": 3.0}
shades = ["#f8fafc", "#eef2ff", "#e0e7ff", "#c7d2fe"]

fig, ax = plt.subplots(figsize=(11, 11))
for ph in rings:
    ax.add_patch(plt.Circle((0, 0), radii[ph], facecolor=shades[rings.index(ph)],
                            edgecolor="#cbd5e1", linewidth=1.2, zorder=1))

for ph in rings:
    members = df[df["Phase"] == ph]
    n = len(members)
    if not n:
        continue
    r_mid = (radii[ph] + inner[ph]) / 2
    for i, (_, row) in enumerate(members.iterrows()):
        ang = 2 * np.pi * i / n + (0.35 if ph != "3" else 0.0)
        r = r_mid + (0.20 * ((i % 3) - 1) if n > 6 else 0)
        x, y = r * np.cos(ang), r * np.sin(ang)
        big = row["Big pharma"] == "yes"
        ax.scatter([x], [y], s=190 if big else 110,
                   c="#7c3aed" if big else "#94a3b8",
                   edgecolors="white", linewidths=1.5, zorder=3)
        name = row["Asset"]
        ax.annotate(name[:21] + "…" if len(name) > 22 else name, (x, y),
                    fontsize=7.6, ha="center", xytext=(0, 11),
                    textcoords="offset points", zorder=4)

for ph in rings:
    ax.annotate(labels[ph], (0, radii[ph] - 0.13), fontsize=10, ha="center",
                color="#475569", weight="bold", zorder=5)

ax.set_xlim(-4.6, 4.6); ax.set_ylim(-4.6, 4.6)
ax.set_aspect("equal"); ax.axis("off")
ax.set_title("TL1A competitive landscape\nmost advanced at the centre; purple = large-cap developer",
             fontsize=14, weight="bold", pad=18)
plt.tight_layout(); plt.savefig("tl1a_bullseye.png", dpi=170, facecolor="white"); plt.close()

# ---- three supporting charts
fig, axes = plt.subplots(1, 3, figsize=(17, 5.2))

counts = [len(df[df["Phase"] == p]) for p in PHASE_ORDER]
axes[0].bar([labels.get(p, p) for p in PHASE_ORDER], counts, color="#7c3aed")
axes[0].set_title("Assets by phase", weight="bold"); axes[0].set_ylabel("assets")
axes[0].tick_params(axis="x", rotation=30)

devs = Counter()
for d in drugs:
    for x in set(d.get("developers") or []):
        devs[x] += 1                      # fold case here to merge Aeglea/AEGLEA
top = devs.most_common(8)[::-1]
axes[1].barh([t[0][:24] for t in top], [t[1] for t in top], color="#2563eb")
axes[1].set_title("Most TL1A assets, by developer", weight="bold")

years = Counter()
for t in trials:
    s = str(t.get("start_date") or "")
    if len(s) >= 4 and s[:4].isdigit():
        years[int(s[:4])] += 1
ys = sorted(years)
axes[2].plot(ys, [years[y] for y in ys], marker="o", color="#059669", linewidth=2)
axes[2].fill_between(ys, [years[y] for y in ys], color="#059669", alpha=0.13)
axes[2].set_title("TL1A trial starts per year", weight="bold")

for a in axes:
    a.spines[["top", "right"]].set_visible(False)
plt.tight_layout(); plt.savefig("tl1a_charts.png", dpi=160, facecolor="white")```
5. What came out
The spreadsheet's first rows, sorted most advanced first:
| Asset | Phase | Lead developer | Lead indication | Trials |
|---|---|---|---|---|
| afimkibart | 3 | Roche | Ulcerative colitis (mod-severe) | 19 |
| tulisokibart | 3 | Merck & Co. | Ulcerative colitis (mod-severe) | 15 |
| duvakitug | 3 | Sanofi | Ulcerative colitis | 7 |
| SPY002 | 2 | Aeglea Biotherapeutics | Ulcerative colitis | 5 |
| BCD-261 | 2 | BIOCAD | Crohn's disease (mod-severe) | 4 |
| SSGJ-627 | 2 | 3S Guojian Pharmaceutical | Ulcerative colitis | 2 |
| FG-M701 | 2 | AbbVie | Inflammatory bowel disease | 2 |
| XmAb942 | 2 | Xencor | Ulcerative colitis | 1 |
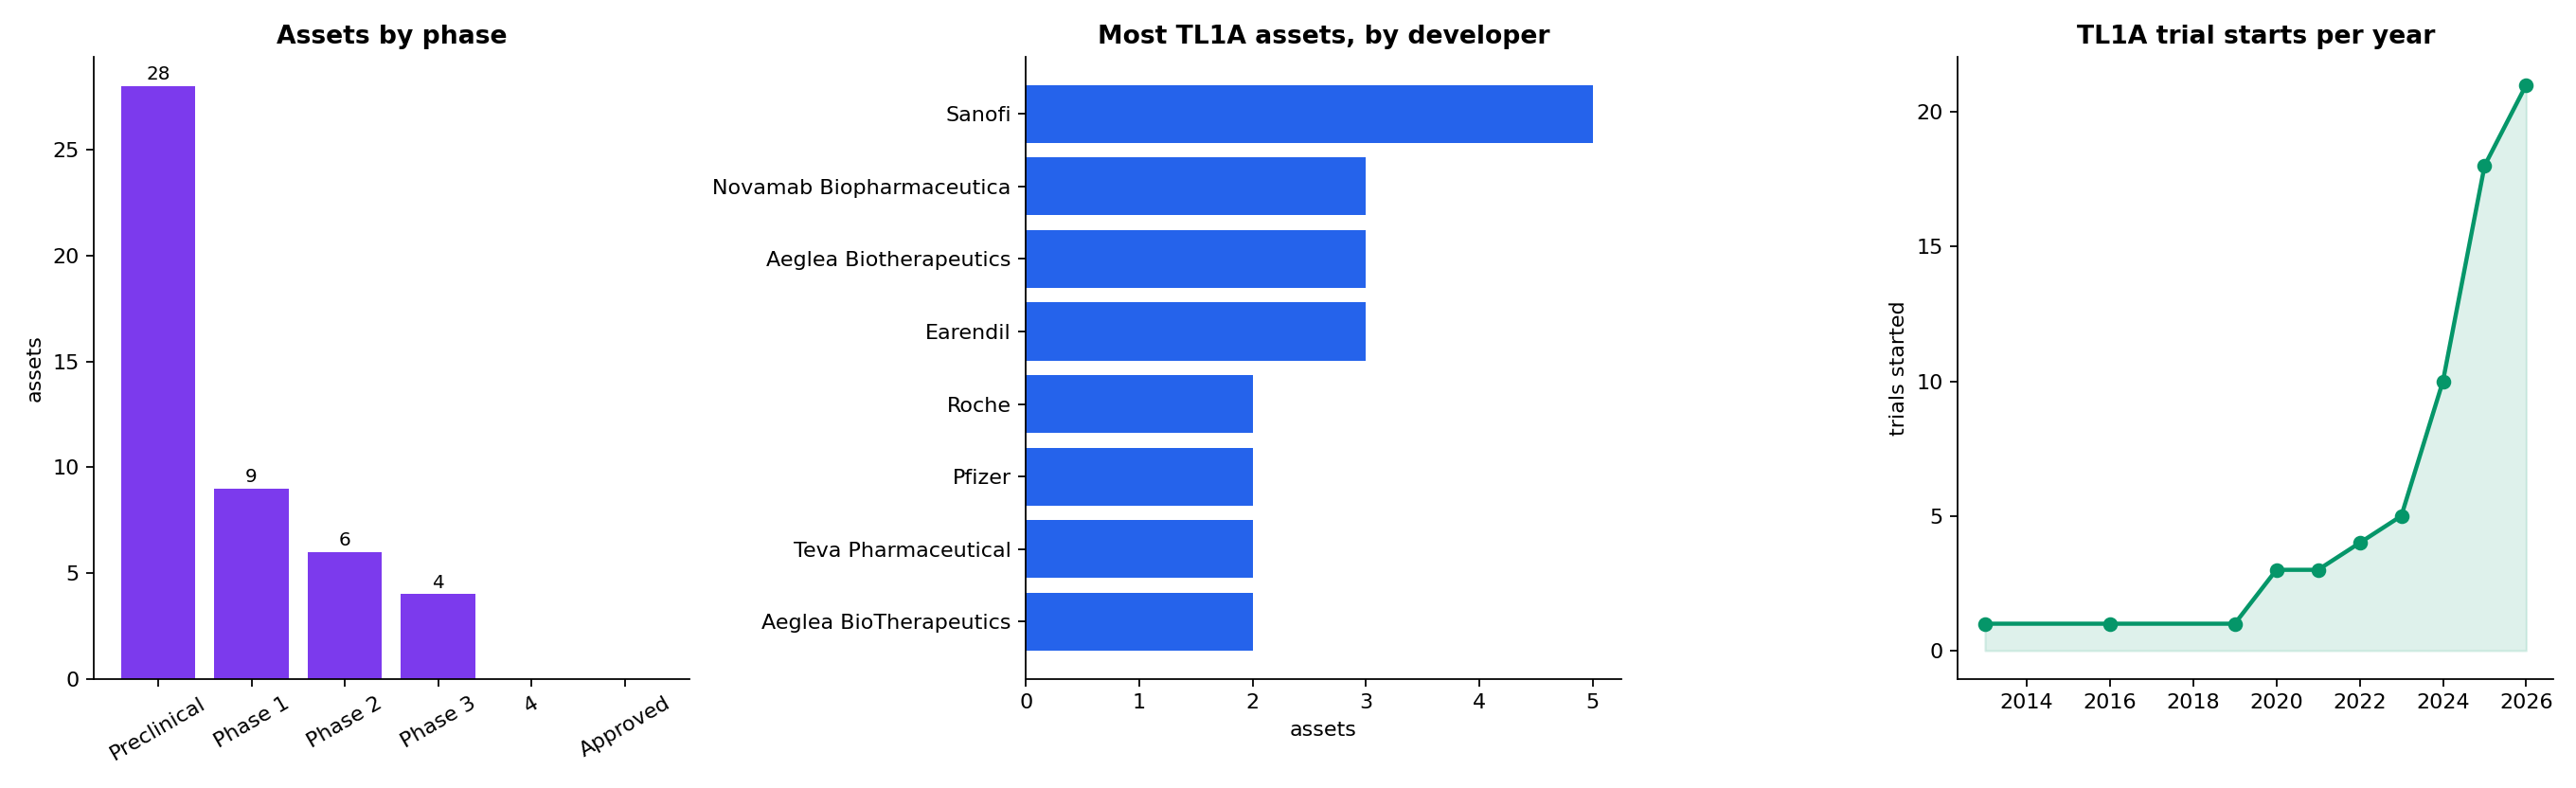
Pulled 2026-09-02. Counts move as the database updates, so your run will differ.
| assets on target | 52 |
| reached the clinic (Ph1–3) | 18 |
Active records | 18 |
| Phase 3 | 3 |
| preclinical | 33 |
| hitting TL1A plus another target | 24, of which 19 an interleukin |
| originator differs from current owner | 16, including all three Phase 3 assets |
| trials | 66, of which 15 have posted results |
| deals | 149 |
Three things worth reading off.
The field is early and crowded. 33 of 52 assets are preclinical against three Phase 3 programmes, all three in ulcerative colitis. Most of this competition has never been in patients.
Nearly half are combinations. 24 of 52 hit TL1A alongside something else, 19 of those an interleukin, usually IL-23. That is a different bet from the one the Phase 3 assets are running: it assumes TL1A alone is not enough.
Every Phase 3 asset was bought, not built. Tulisokibart came to Merck from Prometheus, afimkibart to Roche from Pfizer, duvakitug to Sanofi from Teva. 16 of 52 assets have an originator different from their current owner, and the concentration at the top of the field is total.
Adapting it
The pull is the only target-specific part. Everything downstream is unchanged:
gosset drugs --target TROP2 --limit 100 > drugs.json
gosset drugs --disease "atopic dermatitis" --phase 3 --limit 100 > drugs.json
gosset drugs --target TL1A --disease "ulcerative colitis" --limit 100 > drugs.json
Run gosset schema drugs for the fields available, and Getting Started for the filters each entity accepts.